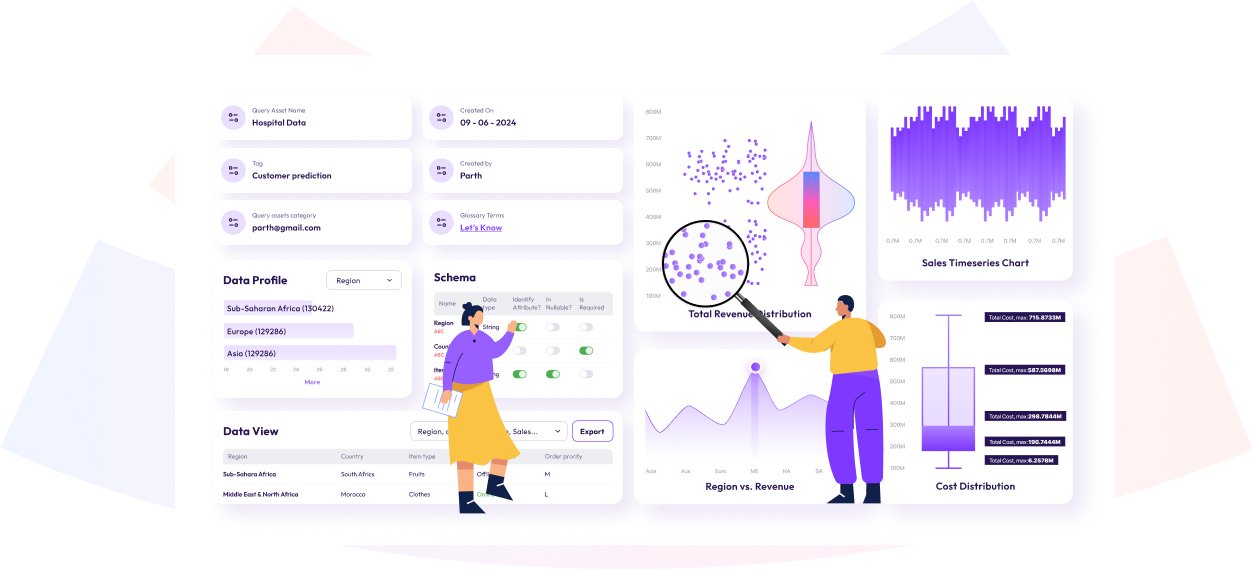
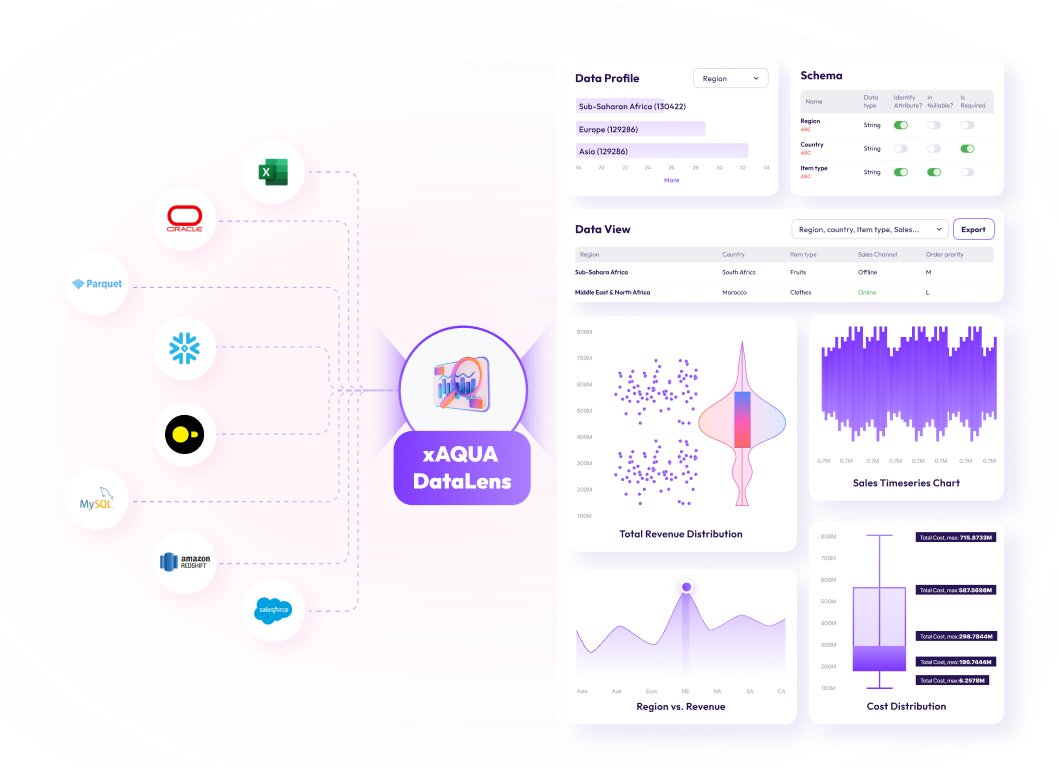
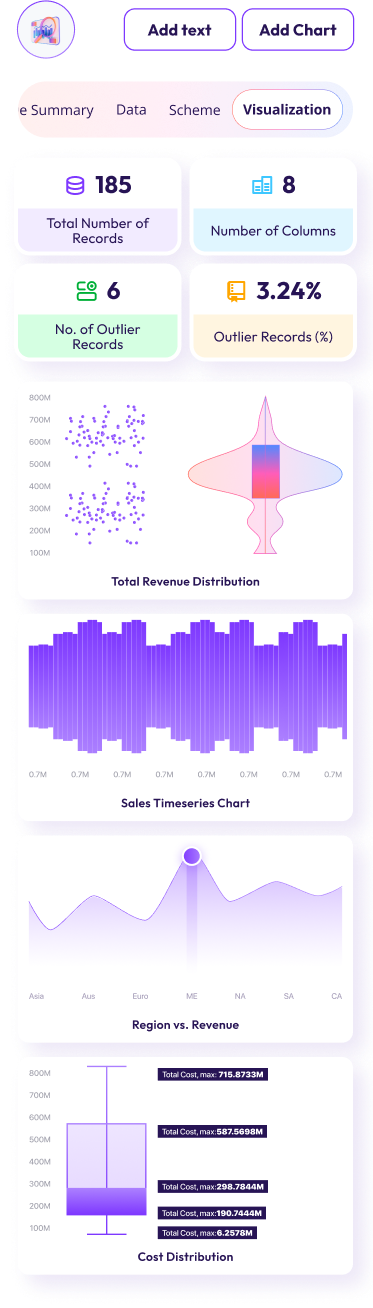
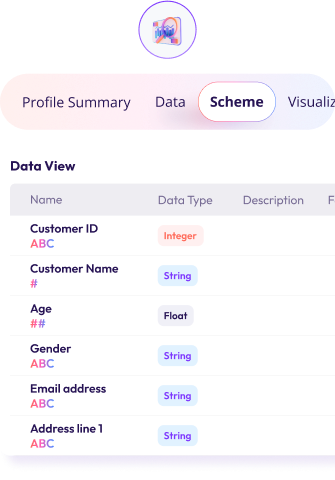
xAQUA® DataLens, with its cutting-edge analytics and data visualization capabilities, is engineered to seamlessly adapt to a broad spectrum of data sources. It supports popular databases such as MySQL, Oracle, SQL Server, Postgres, Snowflake, Redshift, and Salesforce. Additionally, DataLens is versatile in handling various file formats, including DuckDB, CSV, Excel, Parquet, and Arrow. This flexibility ensures that no matter the data environment, DataLens can provide comprehensive profiling, quality analysis, schema examination, and dynamic, no-code data visualization. By offering live data-driven insights through interactive dashboards and a wide range of chart types, DataLens empowers users to make informed decisions with ease and precision across diverse data landscapes.
xAQUA DataLens brings a new dimension to data-driven decisions, transcending traditional reporting. Experience comprehensive analytics including automated data profiling, quality analysis, and schema examination, all integrated seamlessly within your data management lifecycle.
Unlock a detailed understanding of your data’s structure, schema, and profile. DataLens acts as your guide, revealing the intricacies and nuances of your data, empowering you with knowledge for informed decision-making.
With DataLens, visualize your data effortlessly, without any coding requirement. Whether you’re looking at a data file, query result, or a blended data set, DataLens enables you to create engaging charts, graphs, and dashboards intuitively.
Customize dashboards to highlight crucial business metrics and Key Performance Indicators (KPIs). Dive into data with interactive and real-time exploration features, making complex data easily comprehensible.
Choose from a diverse array of chart types – from bar charts and line graphs to pie charts and heatmaps. Pick the visualization that best tells your data story.
DataLens ensures that your visualizations are always fueled by live, up-to-date data, keeping you in sync with the latest insights.
Simplifies data analysis by offering easy-to-use, no-code visualization tools, making advanced analytics accessible to everyone in the organization.
Provides a 360-degree view of data, ensuring users understand its distribution, quality, and anomalies, which is crucial for accurate decision-making.
Offers a wide range of chart types and interactive dashboards, enabling users to customize their data presentation to best suit their analytical needs.
Ensures that visualizations and dashboards are always updated with the latest data, providing real-time insights for prompt and informed decision-making.
Makes it easier for users to navigate and understand complex data structures and relationships, enhancing overall data comprehension.
Embrace the future of analytics and data visualization with xAQUA® DataLens. Experience the blend of advanced technology and user-centric design that makes data not just accessible, but a powerful ally in your business journey.
Discover the unseen. Understand the complex. Visualize the future with xAQUA® DataLens.
2893 Sunrise Blvd, Suite 202
Rancho Cordova,
CA 95742
916.668.6021 sales@xaqua.io
We’re here to help and answer any question you might have. We look forward to hearing from you.
©2023 xAQUA® All rights reserved.